


Localization ROI Measurement Methods: A Practical Guide

The most practical way to prove localization ROI is to measure incremental revenue and quality-of-experience outcomes using a mix of causal methods and business KPIs. Use controlled A/B testing when you have sufficient traffic and experimentation infrastructure. When experiments aren’t feasible, structured observational approaches like synthetic control or interrupted time series provide stronger causal claims than a simple before/after comparison. Historical before/after analysis works for fast directional evidence when speed matters more than causal certainty.
The KPIs leadership cares about are incremental revenue, revenue per visitor (RPV), conversion rate by locale, customer lifetime value (CLV), customer acquisition cost (CAC), support-ticket reduction, and break-even months. Word counts and vendor throughput are operational metrics, not ROI signals.
Immediate next steps:
Define a baseline: capture traffic, conversions, and revenue by locale before any localization goes live
Choose your measurement method based on traffic volume, data availability, and whether experimentation infrastructure exists
Instrument conversion events, locale identifiers, and a localization_release event in your analytics platform
Run the measurement for a pre-specified window with documented KPIs
Report incremental results against full localization cost, including engineering, QA, and maintenance
Table of Contents
Which measurement methods give you the strongest causal evidence?
How to count localization costs and run a sample ROI calculation
What are the most common mistakes that invalidate localization ROI claims?
When is AD VERBUM the right choice for measurement-grade localization?
The measurement gap most localization teams still haven’t closed
AD VERBUM delivers measurement-grade localization for regulated industries
What counts as localization ROI — and what doesn’t
Localization ROI has a precise definition: (incremental revenue or avoided cost attributable to localization − total localization investment) / total localization investment. That formula sounds simple. The hard part is agreeing on what goes into each variable.
In scope:
Localized product experience (UI, onboarding, in-app copy)
Marketing landing pages and paid media assets
Localized support content and knowledge bases
Multilingual SEO impacts (organic traffic by locale, ranking improvements)
Full cost stack: translation, engineering integration, QA, compliance review, DTP, and go-to-market notarization requirements
Out of scope as primary ROI signals:
Raw word counts and TM leverage percentages
Vendor throughput and turnaround speed
Quality pass rates in isolation
Operational KPIs like turnaround time and quality pass rates matter to localization teams, but they measure efficiency, not business impact. Finance needs to see conversion rate by locale, CLV, and CAC moving in the right direction. GA4 is the standard analytics platform for tracking these signals at the locale level. ISO 17100 and ISO 18587 set the quality framework that makes the underlying translation reliable enough to measure. AD VERBUM operates within both standards, which matters when the measurement needs to be auditable.
Which measurement methods give you the strongest causal evidence?
The analytic spectrum runs from weak directional evidence to strong causal claims. Choosing the right method depends on traffic volume, market comparability, data availability, and whether you can run a controlled experiment.

Method | Causal confidence | Time to evidence | Data required | Implementation cost | Suitable use cases |
Historical before/after | Low | 2–4 weeks post-launch | Analytics baseline, consistent tagging | Low | Fast directional read; small markets; regulated content with no experiment option |
Cross-market comparison | Moderate | 4–8 weeks | Comparable control market, consistent tracking | Low–Medium | Multi-market rollouts; when one market localizes and another doesn’t |
Interrupted time series | Moderate–High | 8–16 weeks | Long pre-period time series, stable trend | Medium | Single-market launches; no control market available |
Synthetic control | High | 8–16 weeks | Multiple donor markets, analytics data | High (data science support) | No experiment possible; strong data; regulated or high-stakes markets |
Controlled A/B test | Highest | 2–6 weeks (traffic-dependent) | Sufficient traffic, experimentation platform | High (engineering + tooling) | High-traffic pages; non-regulated content; product localization |
Practical trade-off guidance:
Choose A/B testing when you have enough traffic to reach statistical significance within a reasonable window and an experimentation platform already in place
Prefer synthetic control when no experiment is possible but you have data from multiple comparable markets over a long pre-period
Use before/after when you need directional evidence quickly and the stakes don’t require causal certainty
Pro Tip: Document every concurrent marketing spend change, product launch, and seasonal event before you start measuring. Undocumented confounders are the single most common reason an ROI analysis loses credibility with finance. Use control markets or synthetic controls to isolate the language effect from everything else running simultaneously.
When experiments are infeasible, interrupted time series and synthetic control are the next-best options. Both require more data and analytical capacity than a simple before/after, but they produce claims that hold up under scrutiny.
Which KPIs tie localization directly to business outcomes?
Conversion rate by locale, RPV, retention, and CLV are the direct commercial signals. A perfectly translated asset that doesn’t move any of these metrics is, by definition, a failure from an ROI standpoint.

Primary KPIs and formulas
Revenue per visitor (RPV) RPV = Total Revenue / Total Visitors (by locale) This is your single most useful top-line signal. A localized market with higher RPV than the pre-localization baseline, controlling for traffic mix, is generating incremental value.
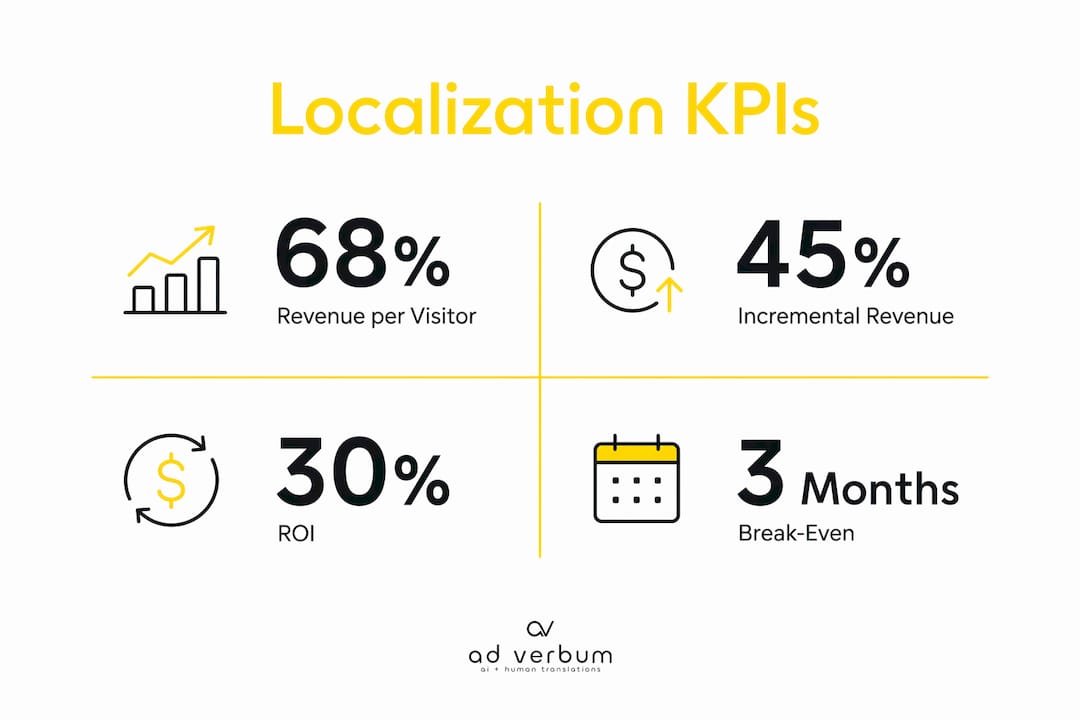
Incremental revenue Incremental Revenue = Localized Market Revenue − Expected Baseline Revenue The baseline is either the pre-localization trend line or the synthetic control estimate. Never use raw revenue growth without subtracting what would have happened anyway.
ROI ROI = (Incremental Revenue − Total Localization Cost) / Total Localization Cost
Break-even months Break-Even Months = Total Localization Cost / Monthly Incremental Revenue
KPI | Definition | Source system | Where to pull |
Incremental revenue | Revenue above baseline attributable to localization | Analytics + billing | GA4 revenue events, CRM |
Revenue per visitor | Revenue / visitors by locale | Analytics | GA4 e-commerce reports |
Conversion rate by locale | Conversions / sessions by locale | Analytics | GA4 funnel exploration |
Average order value (AOV) | Revenue / orders by locale | Billing / CRM | Order management system |
CLV by locale | Predicted lifetime revenue per customer | CRM | CRM cohort reports |
CAC by locale | Marketing spend / new customers acquired | CRM + ad platforms | CRM + Google Ads / paid media |
Retention / churn delta | Retention rate change post-localization | CRM | CRM cohort analysis |
| Support ticket reduction | Ticket volume change by locale | Support desk | Zendesk, Salesforce Service Cloud |
Secondary indicators — time on page, bounce rate, and engagement depth — are useful for diagnosing why conversion rates move, but don’t present them as ROI evidence to finance.
Pro Tip: When revenue isn’t directly measurable (a pre-revenue product, a regulated market with indirect sales), use validated surrogate metrics: RPV, qualified leads, or pipeline velocity. Document the conversion assumptions you use to translate surrogates into revenue estimates. Finance will ask, and a documented assumption is far more credible than an undocumented one.
How to count localization costs and run a sample ROI calculation
Hidden costs are the most common reason ROI models overstate returns and lose credibility with finance. Engineering, QA cycles, CMS overhead, and ongoing maintenance are routinely omitted.
Full cost categories
Direct costs:
Translation (per word or per project)
Engineering and CMS integration (locale routing, build pipeline changes)
QA and subject-matter expert review
DTP and multimedia adaptation
Project management
SEO and content adaptation
Legal and compliance review
Hidden costs to include:
Locale-specific technical debt (infrastructure, locale-aware logic)
Increased testing cycles per release
Post-launch bug fixes for locale-specific issues
Governance and audit overhead for regulated content
Tooling subscriptions (TMS, terminology management)
Ongoing maintenance per locale per year
Sample ROI calculation
Assume a SaaS company localizes its product into German for the US enterprise market’s European expansion:
Total localization cost (translation + engineering + QA + maintenance year 1): a substantial investment
Monthly incremental revenue attributed to the German locale (post-launch average): a significant monthly gain
Break-even months calculated as total cost divided by monthly incremental revenue
12-month incremental revenue estimated as monthly gain multiplied by 12
ROI at 12 months calculated as (incremental revenue minus total cost) divided by total cost
That 80% figure is what goes on slide one of the leadership deck. The cost breakdown and method details go in the appendix.
Before calculating ROI, gather:
Purchase orders and invoices for all translation and vendor costs
Engineering time estimates (hours × loaded hourly rate)
QA and SME review hours
Expected traffic uplift by locale (from SEO forecast or paid media plan)
Baseline conversion rate and RPV for the target locale
Ongoing maintenance cost estimate per locale per year
What do you need to instrument before you start measuring?
A pre-launch baseline and a documented release event are non-negotiable. Without them, before/after analysis is guesswork.
Instrumentation checklist:
Locale-aware URLs (subdirectories, subdomains, or hreflang tags) or locale cookies, consistently applied
UTM parameters on all localized paid and owned channels, with locale included as a dimension
Conversion events and funnel events tagged per locale in GA4
Revenue attribution mapped to locale in both analytics and CRM
CRM lead fields capturing locale at point of acquisition
Support-ticket language tags for support-cost measurement
A localization_release custom event fired at go-live, so analysts can filter pre/post windows cleanly
GA4 considerations
Configure separate data streams per locale only when traffic volume justifies it. For most teams, a single stream with locale as a custom dimension is cleaner and easier to maintain. Cross-domain measurement requires consistent cookie configuration and linked properties. Use GA4’s DebugView to validate event firing before launch, not after.
Attribution caveats: Multi-touch attribution distributes credit across the funnel, which tends to understate the impact of localized landing pages that appear early in the journey. Last-click attribution overstates the final touchpoint. For localization measurement, first-touch attribution often gives a cleaner read of whether the localized entry point is driving new acquisition. Document which model you use and apply it consistently across all locales.
Pro Tip: Keep a single canonical event schema across all languages. If the English site fires purchase_complete with a locale parameter, every localized version fires the same event with the same parameter. Schema drift between locales is one of the hardest data quality problems to fix retroactively.
A step-by-step measurement runbook you can copy
This sequence works for both A/B tests and before/after analyses. Adapt the sample size and window guidance to your method.
Define your hypothesis and primary KPI. Example: “Localizing the German product page will increase RPV for German-locale visitors by 15% within 90 days.” One hypothesis, one primary KPI. Secondary KPIs are fine but don’t let them drive the go/no-go decision.
Identify your baseline period and control markets. For before/after: use at least 8 weeks of pre-launch data. For A/B: run the experiment until you reach your pre-specified sample size. For synthetic control: use 12+ months of pre-period data from donor markets.
Instrument events and tag all assets. Run the instrumentation checklist above. Fire the localization_release event at go-live.
Run the pilot or experiment. For A/B tests: don’t stop early. Pre-specify the window and stick to it. Peeking at results and stopping when you see a positive signal inflates false-positive rates.
Collect data for the pre-specified window. Minimum 2 weeks for A/B tests on high-traffic pages; 8–12 weeks for before/after; 12–16 weeks for synthetic control.
Run the analysis. For A/B tests: check statistical significance (p < 0.05 is the standard threshold) and practical significance (effect size). For observational methods: check for parallel pre-trends between treatment and control.
Prepare the leadership report. Lead with headline ROI and break-even period. Show the evidence layer. Appendix gets the raw tables and method details.
Pre-analysis quality checks:
Confirm event data is complete with no gaps in the measurement window
Check for event duplication (double-fired purchase events inflate revenue figures)
Verify consistent currency handling across locales
Confirm the control market or control group had no concurrent major interventions
What are the most common mistakes that invalidate localization ROI claims?
Most ROI analyses that fail with finance fail for one of six reasons.
Excluding hidden costs. Engineering, QA, maintenance, and governance overhead are routinely omitted, which overstates ROI and destroys credibility when finance audits the model. Include them from the start.
Using word counts as primary metrics. Words translated is an output metric. It tells you nothing about whether the localized experience drove revenue. Present it as an operational KPI, never as evidence of ROI.
Failing to control for concurrent campaigns. A product launch or a paid media surge in the same market during your measurement window will contaminate the result. Document the marketing and product calendar before you start, and use control markets to isolate the language effect.
Seasonality confounders. Comparing Q4 post-localization to Q2 pre-localization will produce a meaningless result in most consumer categories. Use year-over-year comparisons or synthetic controls that account for seasonal patterns.
Insufficient sample sizes. Running an A/B test for two weeks on a low-traffic page and declaring victory is a common mistake. Calculate the required sample size before launch using a power analysis, and don’t stop the test early.
Poor QA on localized assets. Measuring the impact of a poorly localized page tells you nothing useful about what good localization would do. QA sign-off before measurement starts is a prerequisite, not an afterthought. Poor localization of legal or trust-critical assets can actively erode conversion rates, as merchant agreement localization failures demonstrate.
Pro Tip: Maintain an issue log of post-launch problems — broken locale routing, terminology errors, display bugs — and quantify their estimated revenue drag. When an outlier appears in your data, you’ll have a documented explanation rather than a credibility gap.
When is AD VERBUM the right choice for measurement-grade localization?
Standard localization workflows are adequate for general marketing content with low compliance stakes. When the content is regulated, the data is sensitive, or the measurement needs to be auditable, the provider selection criteria change.
Decision conditions where AD VERBUM fits:
The project handles regulated content: medical device documentation, clinical trial materials, financial prospectuses, legal agreements, or defense documentation
The organization requires EU data sovereignty (GDPR-aligned processing, no public cloud exposure of sensitive content)
SME oversight is required for technical accuracy and regulatory compliance
The QA process must align to ISO 17100, ISO 18587, or sector-specific standards like MDR
The measurement needs to be audit-ready, with documented terminology governance and QA artifacts
AD VERBUM’s workflow for measurement-grade projects follows a specific sequence: client Translation Memories and Term Bases are ingested first, ensuring terminology consistency from the first segment. The proprietary LLM-based LangOps System then generates output constrained by that terminology and style guidance. A certified subject-matter expert reviews for technical accuracy, regulatory compliance, and contextual nuance. QA is then aligned to ISO 17100 and ISO 18587, and where relevant, to MDR or other sector requirements.
That sequence matters for measurement because terminology drift between locales is one of the hardest confounders to control for. When the same concept is translated differently across pages or releases, conversion rate differences between locales may reflect terminology inconsistency rather than language preference. AD VERBUM’s proprietary LLM approach enforces terminology governance at the generation stage, which reduces this source of measurement noise.
AD VERBUM holds ISO 9001, ISO 17100, ISO 18587, ISO 13485, ISO 27001, ISO 42001, ISO 14001, and AQAP2110 certifications, independently audited by Bureau Veritas. Its LangOps System runs on EU-hosted private infrastructure with GDPR and HIPAA alignment, and its network of 3,500+ subject-matter expert linguists covers medical, legal, engineering, and defense domains. For regulated content where the localization pipeline itself must be auditable, these controls reduce the compliance risk that would otherwise contaminate measurement results.
For teams in regulated industries building a localization business case, AD VERBUM also supports instrumented launch preparation: TM and termbase integration, pre-launch QA artifacts, and tagging support to ensure the measurement window starts with clean data.
How do you present localization ROI results to leadership?
Lead with the headline number. Finance and executive audiences want to know the ROI percentage and break-even period before they want to see methodology. Give them that in the first 30 seconds, then layer in the evidence.
What to include in the presentation:
Headline ROI and break-even period (slide 1)
Primary KPIs: RPV uplift, conversion rate delta, CLV change by locale
For A/B tests: confidence intervals and p-values; for observational methods: pre-trend parallel test results
Full cost breakdown (direct and hidden costs)
A short list of assumptions and caveats (attribution model used, baseline period, control market selection)
Framing that works with finance:
Present evidence in layers. Start with the headline ROI. Then show the A/B test result or cross-market comparison that supports it. Then show the cost breakdown. Then show the risk mitigations (QA sign-off, confounder controls). Finance teams are trained to look for the weakest link in an ROI argument. If you show the caveats yourself, you control the framing.
Dashboard layout for ongoing reporting:
A one-page snapshot with three to four top metrics works better than a dense report. Include visualized pre/post trend lines for RPV and conversion rate by locale. Keep the raw data tables and method details in an appendix for audit review. Mixing revenue lift, cost savings, and top-of-funnel indicators in one view gives leadership the full picture without requiring them to interpret raw analytics exports.
Key Takeaways
The most reliable localization ROI measurement methods combine causal rigor with full cost accounting: use A/B testing when traffic allows, synthetic control or interrupted time series when it doesn’t, and always measure incremental revenue against the complete cost stack.
Point | Details |
Choose method by causal strength | A/B testing gives the strongest causal claim; use synthetic control or interrupted time series when experiments aren’t feasible. |
Measure business KPIs, not output | Track RPV, conversion rate by locale, CLV, CAC, and break-even months — not word counts or TM leverage. |
Include all cost categories | Engineering, QA, maintenance, and governance overhead must be in the cost model or the ROI figure will not survive finance review. |
Instrument before you localize | Capture a baseline and fire a localization_release event at go-live; without these, before/after analysis has no anchor. |
AD VERBUM for regulated work | For medical, legal, finance, or defense content requiring ISO-aligned QA, EU data sovereignty, and SME oversight, AD VERBUM provides an auditable, measurement-grade localization pipeline. |
The measurement gap most localization teams still haven’t closed
The conventional wisdom in localization measurement is to start with the ROI formula and work backward. That’s the wrong order. The teams that produce credible ROI evidence start with instrumentation, not calculation.
The most persistent gap isn’t a lack of methods or frameworks. It’s that localization launches happen before anyone has agreed on a baseline, a measurement window, or a primary KPI. The result is a post-hoc analysis built on incomplete data, which finance correctly discounts.
The second underappreciated problem is cost completeness. Most ROI models omit hidden costs like locale-specific engineering, QA cycles, and ongoing maintenance. An 80% ROI that becomes 30% when engineering time is added doesn’t just look bad — it damages the localization team’s credibility for the next budget cycle.
My practical recommendation: treat the measurement plan as a deliverable that ships before the localization project starts, not after. Define the hypothesis, the baseline period, the primary KPI, and the full cost model before a single word is translated. Use synthetic control when exact experiments aren’t possible, and always pre-register the analysis window so you can’t be accused of cherry-picking the result. Quantify support-ticket reductions as cost savings — they’re often the fastest win to demonstrate and the easiest to attribute directly to localization quality. Finally, create a localization measurement playbook and tie monthly snapshots to finance reviews. A single well-documented pilot per quarter, reported consistently, builds more organizational trust than a one-time ROI study that no one can replicate.
AD VERBUM delivers measurement-grade localization for regulated industries
For localization managers who need their translation pipeline to hold up under audit, AD VERBUM offers a concrete alternative to generic language service providers. The difference isn’t just speed — AD VERBUM’s AI+HUMAN hybrid translation runs 3x to 5x faster than traditional workflows while maintaining ISO 17100 and ISO 18587 QA alignment, EU-hosted data sovereignty, and SME review by certified subject-matter experts across medical, legal, engineering, and defense domains.

For measurement-grade projects, AD VERBUM integrates your existing Translation Memories and Term Bases at intake, enforces terminology governance through its proprietary LangOps System, and delivers pre-launch QA artifacts that give your analysts a clean measurement baseline.
That means your before/after or A/B analysis starts with verified, consistent localized assets — not a confounded dataset. For teams in regulated sectors building a localization ROI case, that audit trail is the difference between a credible finance presentation and one that gets sent back for rework.
Request an evaluation or contact AD VERBUM to scope a measurement-grade localization engagement for your next market.
Sources and further reading
How to Measure Localization Impact: Frameworks & Methods — Nimdzi. Covers A/B testing as the gold standard for causal claims, plus interrupted time series and synthetic control as advanced observational methods. Recommended for statistical methods and method selection logic.
How to prove localization ROI when attribution gets complicated — Veracontent. Covers outcome-based ROI models mixing revenue lift, cost savings, and commercial risk reduction; also the definitive source on hidden costs (engineering, QA, maintenance). Recommended for cost modeling and failure modes.
Localization ROI: measuring revenue impact — SimpleLocalize. Identifies conversion rates, RPV, retention, and CLV as central ROI metrics; covers surrogate-to-revenue mapping. Recommended for KPI selection and surrogate metric documentation.
Measure Localization Success Beyond Translation Quality — Revue. Recommends combining revenue lift, cost savings, and top-of-funnel indicators; advocates one-page leadership snapshots. Recommended for presentation format and reporting cadence.
6 Key Metrics Every Localization Manager Should be Sharing — Phrase. Covers six operational KPIs and explains why they measure efficiency rather than business impact. Recommended for separating operational from business KPIs.
Localization Investment Business Case: A Finance Guide — AD VERBUM. Practical guidance on building a finance-ready business case with quantitative evidence for localization investments.
Understanding Translation and Notarization in Ontario — The Online Notary. Practical guidance on translation and notarization for legal documents in jurisdictions where notarization affects go-to-market timelines and compliance requirements.
Recommended

